5 Types of IELTS Writing Task 1 Reports
This post will compare the five types of IELTS writing task 1 questions and explore ways to address them.
All the task 1 questions can be classified into the following:
1.Graph and table – line chart, bar chart, proportional bar graph, and table
2.Pie charts
3.Multiple chart and graph
4.Map and floor plan
5.Process diagram
Although for all question types, we need to identify the most significant features and trends of the picture, there are some differences when dealing with each type.
1. Graph and table
There are few things to consider when constructing your report.
Firstly, we need to know what kinds of graph or table is in the question. Below are some common types:
Line chart

Bar chart

Retrieved from (http://www.ielts-exam.net/IELTS-Writing-Samples/Bar-Chart.html)
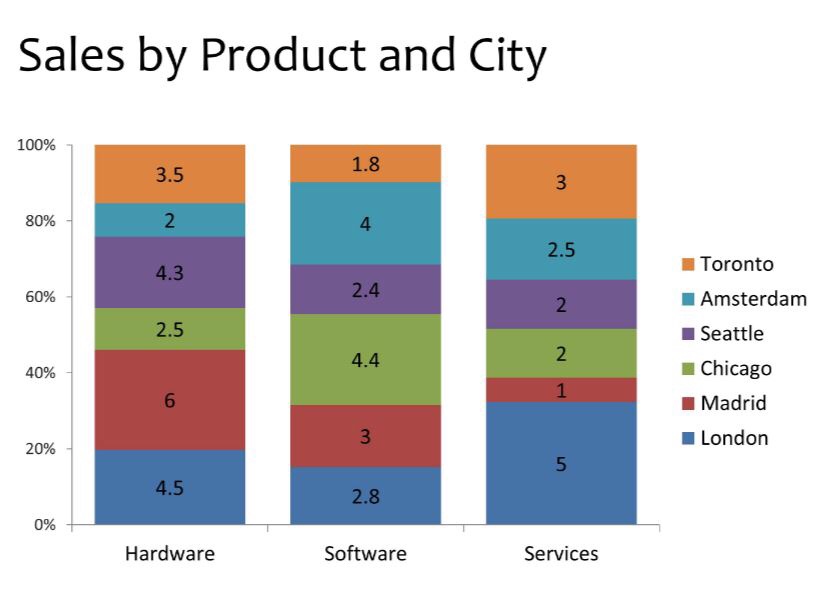
Proportional bar chart

Retrieved from (http://speakingppt.com/2011/05/04/5-exciting-alternatives-to-boring-powerpoint-charts-and-tables/)
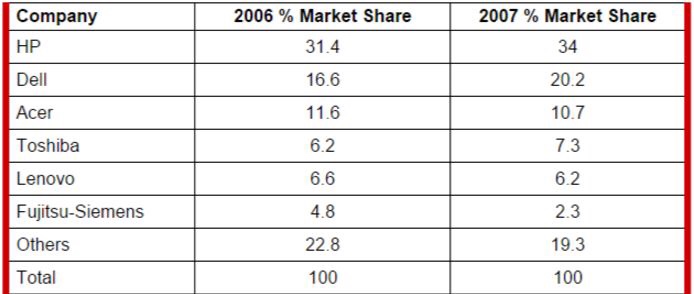
Table

Retrieved from (http://www.ielts-exam.net/academic_writing_samples_task_1/862/)
Secondly, we need to consider whether it covers a period of time or is it static. Most of the graph questions are dynamic, meaning they cover a period of time. For a dynamic chart question that moves along the time, we need to pay attention to the tenses of the question – is the data in the past, at present, or does it extend into the future? This can be neglected if the question is a static one that does not involve time.
Thirdly, for line, bar, and proportional bar charts, it is necessary to identify the information on both of the axes. This, together with the title of questions, tells you the unit of measurements, which we will need to refer to in the report.
When constructing your report, it is essential to include the highest and lowest number; the beginning and ending figures; general trends and the most obvious feature of the graph. Refer to this post for more information:
In short, things we need to consider for a graph question:
▪ What type of graphs?
▪ Is it across a period of time?
▪ Is the time based in past, present, or future?
▪ What are the units of measurements?
▪ What is the information on the two axes?
2. Pie charts
Most of the pie charts present information in terms of percentage.

Retrieved from (https://littlethinkersmind.wordpress.com/2015/08/28/ielts-101-writing-task-1/)
Like the graph and table, pie charts can be dynamic or static. They might compare datas in two different years, locations, study groups or countries. If the pie chart covers a range of time, then we need to consider the tenses in the report – whether it is based in past, present or future.
Also, it is a common mistake that candidates mistaken the percentages for actual figures. For instance, in the above pie charts, they might write “the travel category began at 36”. It is actually 36%.
Moreover, we need to think about the categories of distribution. Often, the figure is about a group or a particular industry or sector.
Therefore, things we need to bear in mind for a pie chart question:
▪ Is it across a period of time?
▪ Is the time based in past, present, or future?
▪ Are the measurements in percentages? (this is the most common measurements)
▪ What is the category of data from?
3. Multiple charts and graphs
Although this is not a very common question type, many candidates get confused about how to approach it as they find the information contained overwhelming.

Retrieved from (http://ielts-simon.com/ielts-help-and-english-pr/2015/02/ielts-writing-task-1-two-different-charts.html)
It is indicated in the IELTS marking criteria that we need to “make comparisons where relevant”. However, there may not be relevant comparisons to make. The key is to select and compare accordingly.
Using the above example, the left bar graph tells us data about the number of men and women enrolled in the four courses while the right pie chart conveys information about the age of students. There is not much to compare besides stating that the majority of the students are 50 years old and over and the enrollment statistics are formed mainly by these students.
We should then mention the bar graph and pie chart separately as they are presenting different details.
Therefore the main takeaway here is: do not try to compare the two graphs if the data is not relevant.
4. Map and floor plan
The candidates usually have about 20% chance to get either a map or process diagram question in the IELTS writing task 1 exam.

Retrieved from (The Official Cambridge Guide to IELTS, pg. 283)
Usually, this type of question compares two maps in different years, with changes in buildings, landmarks, and infrastructures. Just like other types, we need to pay attention to the year in the picture and construct our report with the appropriate tenses. The two maps may take place in the past, present, or future.
In additional, commenting the relative locations of changes by referencing the compass is important. For instance, “the farmlands to the south-east of the bridge were replaced by houses”.
This type of question also requires an overview that describes general changes. Ask yourself “Is the place becoming more modern, countryside, industrial, or residential?”. We may use vocabulary such as modernization, transformation, urbanization, or commercialization to illustrate the changes. For instance, “the village underwent considerable modernization from 1930 to 2010.
To sum up, things to consider:
▪ Is the time based in past, present, or future?
▪ What are the relative locations of changes?
▪ What are the kinds of development
5. Process diagram
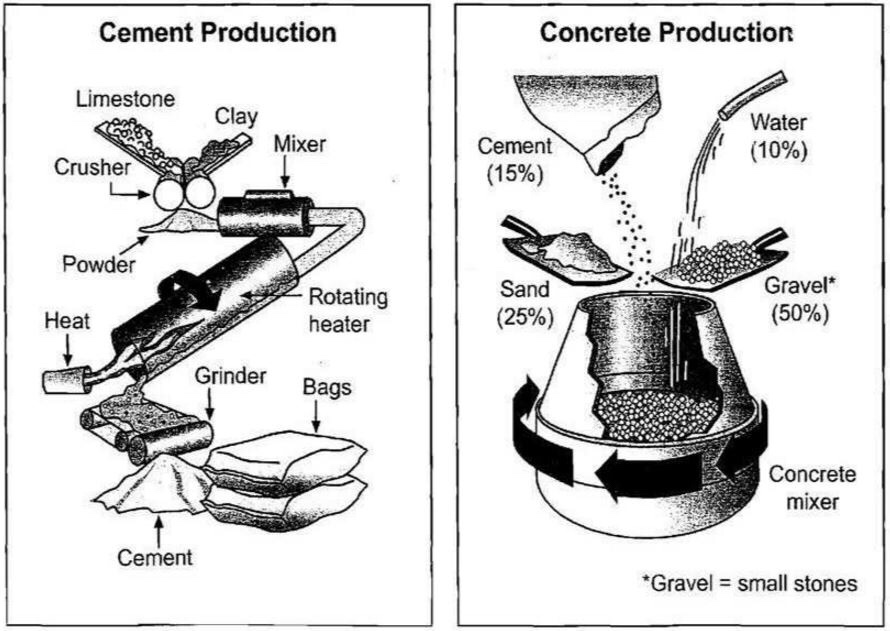
A process diagram question includes several steps in which something takes place. Because there is not as much information in the diagram as other question types, it is best that we write about every step in the report.

Retrieved from (Cambridge English IELTS 8, pg. 78)
The distinctive point about process diagrams is that time and year are usually irrelevant. They are always static.
Here the first and last step of the process are vital. We also need to talk about how many different stages are there in the diagram and how they are related. Often, the process can be divided into a cyclical type that restarts itself or linear type that ends itself.
Taking the above diagram, for example, the process begins when the limestone is combined with clay and goes into the crusher and ends when various ingredients are mixed in the concrete pot.
There are around 6 steps in the process and 2 stages in the process – cement production and concrete production. The latter can not happen without the cement production. Also, it is a linear process.
In brief, things that we need to think about are:
▪ What is the first and last step of the process?
▪ How many stages are there and how they are related to each other?
▪ Is the process a cyclical or linear type?